

Last week I published the first post in this series of undetermined length. Here is post number two. As a recap, bug Number One was the lack of a definition for the term e-Learning Quality. Bug Number Two was the excessive focus on course design and the lack of focus on more important pieces (IMO) of e-Learning Quality. Here are the next two bugs.
Three.
This one goes hand-in-hand with the issue about defining quality. We need to look at quality as a continuum, something along the lines of the graphic below.
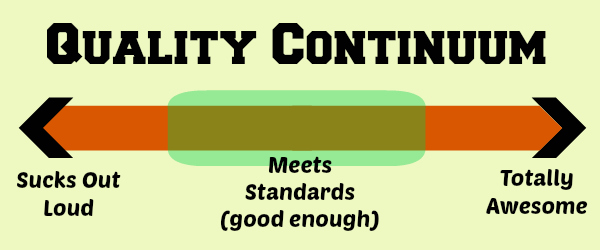
When people use the term “eLearning Quality,” we usually assume they mean high quality or excellent quality, but of course there can also be low quality. In other words, the term “quality” is really not descriptive enough. Just adding the word assurance, such as in a quality assurance program, still doesn’t cut it for me. “I assure you that your quality is really crappy.” How’s that for quality assurance?
We would be better off to talk about Excellence in e-Learning, or my preferred term of Excellence in e-Education. The other thing that the chart illustrates is that most quality standards tend to aim at the large middle section – which is indicative of being good enough, rather than excellent. It’s really not that high a bar. My suggestion is that you stop talking about Quality, and start talking about Excellence.
Four.
Very often a discussion about e-Learning Excellence comes around to a comparison of course completion rates between online courses and F2F courses. That focus on completion rates is seriously misplaced. It’s a classic case of comparing peaches to pears.
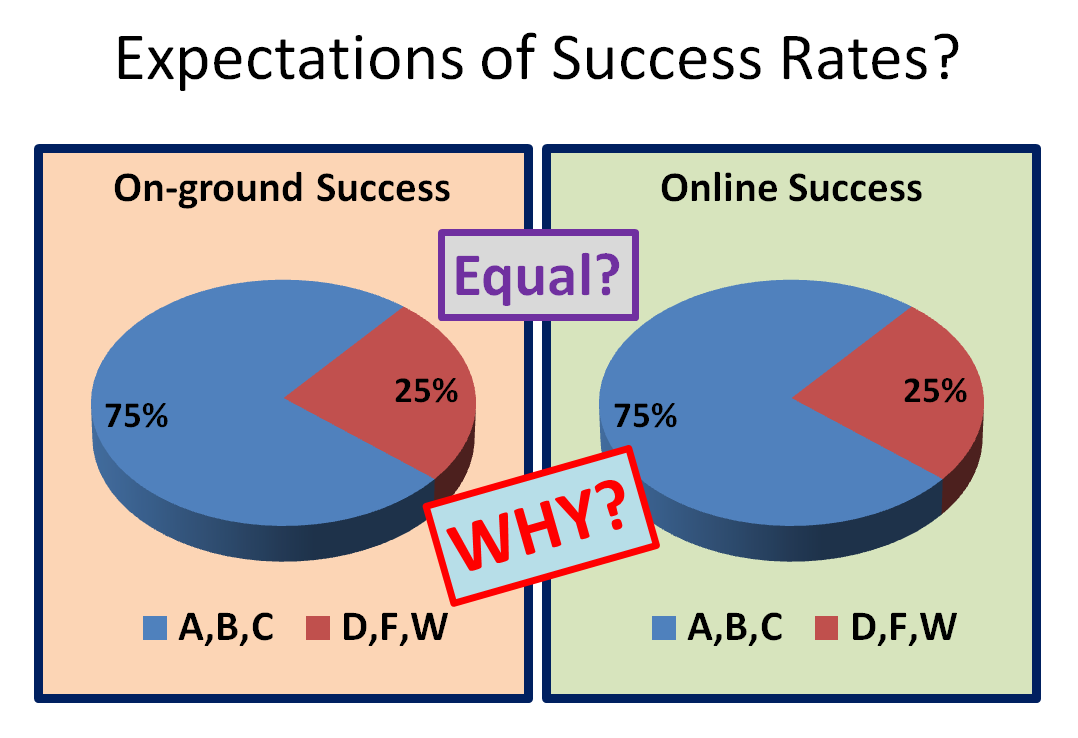
Of course it makes perfect sense to most people when that comparison is made. Those people believe that if online learning results in fewer successful course completions, it must be due to the lower level of quality for those online courses. What other reason could there be? Well, there could be several other reasons. Here are some of those reasons:
1. Demographics differences (Learning House Report pages 27-31)
We know that there is a fair number of students who mix F2F classes with online classes. But we also know that those students who are exclusively engaged in online learning, taken as a group, have some different demographics than those who engage exclusively in F2F learning. In other words, they are not two homogenous groups. Online students work more hours (60% of them work full-time), are more likely to be parents (and especially single parents), and are more likely to be part-time students rather than full-time. In fact, those demographics differences are some of the reasons why students choose an online education path in the first place – because their plates are already pretty full. See also the demographics differences from my former college.
2. Differences in student support
All students need many support services, and the on-campus services are typically better delivered than the comparable online services. Sure, some schools are doing an exemplary job of providing online access to a full range of student services, but many others are not.
Online students expect 24/7 access to these services (L/H page 20), but see a significant performance gap (Noel/Levitz pg. 6) in those services provided by their colleges and universities:
- Online library and research
- Technical support
- Academic advising
- Career placement
3. Differences in instructor preparation/familiarity
Every term there are lots of faculty members who teach their very first online class. Sure, there are also some faculty who are teaching their very first F2F course, but not to the same level as the number of noobs for online teaching. And besides, chances are good that the first-time F2F teacher has been sitting in F2F classrooms as a student for 15-20 years before their first attempt at teaching in the same setting. It’s not unfamiliar territory.
At my former college, I tracked the student final course grades in classes that were taught by new online faculty over their first few semesters. This was not part of their evaluation, nor was it used in any significant way with, for, or against the instructor. I was simply curious. What happened to student performance as the instructors became more experienced with online teaching? I doubt that you’ll be surprised that student achievements (as measured by final grades) generally got better as the instructor gathered experience with the modality. The chart below is based on real data collected about dozens of faculty members who started teaching online courses during my tenure at the college. These three anonymized instructors are representative of the typical data – although there were a few exceptions to this general upward trend. Loosely speaking, I think the data show that instructors see better results from their students as the instructor gains more experience in online teaching. I don’t think that’s surprising, but I do think it’s something that we need to consider about the maturity of online education. We get better at it the longer we do it. At least most of us do.

NOTE: this chart depicts the percentage of students who successfully completed (passed) an online class during the first five terms that an instructor taught that class online. In each case, this was the instructor’s first foray into online teaching.
4. Differences in student familiarity with online learning
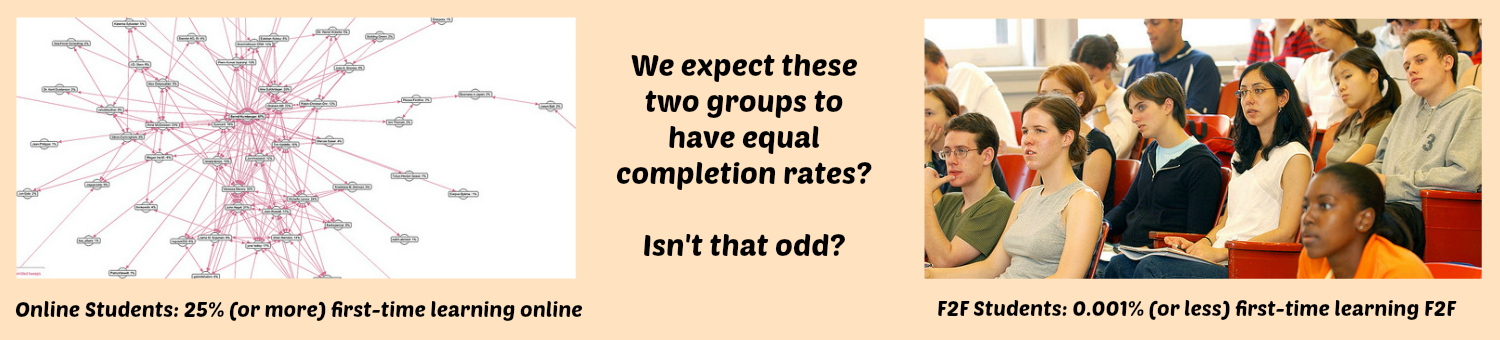
Much like newbie faculty members, there are also a new batch of first-time online students each and every term. Every fall term at my former college, about 40% of the online students were first-time online learners. No matter how many years of schooling they had endured, this was their first taste of online learning. That 40% figure remained fairly constant from about 2005 to 2010, when I left the college. Nationally, the rate is probably below that number, and it is probably slowly going down over the years as online learning is less and less of a novelty. I’d say that a conservative estimate of the overall rate is 25%. In other words, every time a new term starts, at least 25% of the online students are taking their first-ever online class. It’s probably a higher rate, but 25% is high enough to make the following point.
At the beginning of each term, what percentage of students sitting in a traditional F2F classroom are doing so for the very first time?
Effectively zero percent. Let’s allow for the occasional home-schooled student who has never been in a traditional classroom – not ever. It could happen. So, let’s conservatively estimate that about 0.001% of the F2F students are sitting in a F2F classroom for the first time ever.
And yet we expect those two groups to achieve the same level of success in those courses? Doesn’t that sound just a little bit insane?
Click to enlarge
Online course completions continue to get better and better, as we figure out how to be more effective online educators and as students learn how to be better online learners. If anything, the e-Learning Atheists (naysayers) should be concerned that the difference in rates is so small, and getting smaller. More about those improving completion rates next time.
Filed under: e-Quality, Online learning |

Quality vs. Excellence is a most excellent distinction. I think that helps broaden the perspective so the focus is not just on course design. For some reason I couldn’t help but think of Bill and Ted’s Excellent Adventure. A unique learning experience for them of course, but perhaps an apt metaphor for e-Education. The phone booth was their internet. The question of ‘what is excellence’ remains then. Is there danger of that being subjective? Granted it is probably more precise than Quality (as the first graphic indicates). But whose measure is to be used? A rubric? A panel of reviewers? or the Student? Is it measurable / attainable? or…is the process of pursuit the real value? Is excellence the pot of gold at the end of the rainbow…always just beyond reach…yet we can measure if we are still in pursuit and on the right path.
Just some ramblings induced by the bugs…thanks!
Lovin’ this series.
Jay.